Introduction
Put three wholesale VoIP rate quotes side by side and the lowest number usually wins the decision — which is exactly the mistake that costs the most money over a year of traffic. 009, because the number alone says nothing about billing increments, route quality tier, volume commitments, or the surcharges that show up on the invoice but never appear on the quote.
This guide isn't about negotiating a better rate or reading a rate deck after you've signed — it's about the comparison step that happens before any of that, turning three or four incompatible-looking quotes into numbers you can actually put side by side and trust.
Why Two "Same" Rate Quotes Rarely Cost the Same
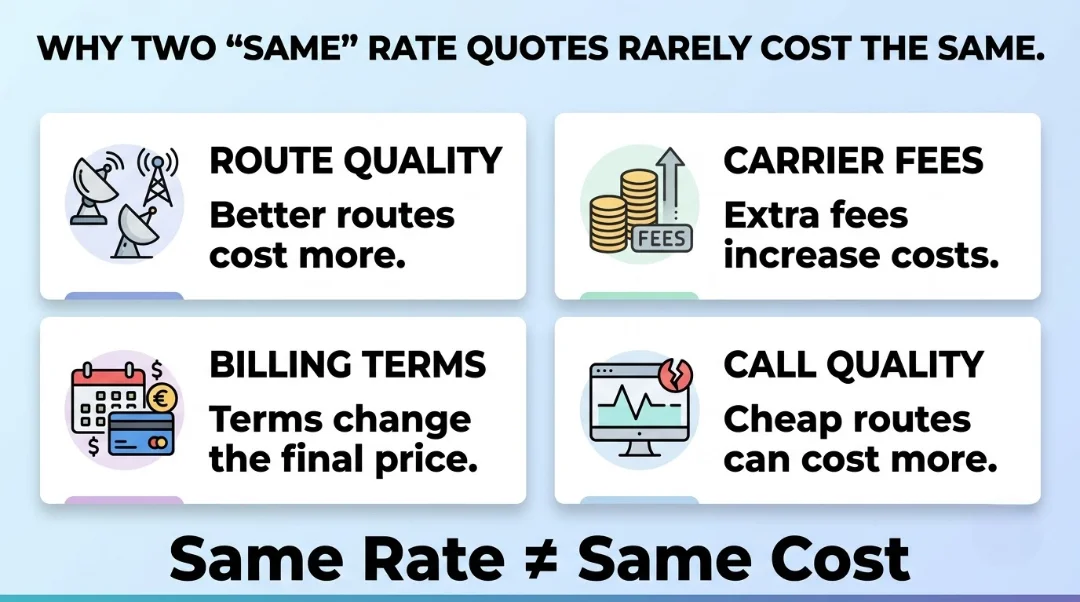
A per-minute rate is only one input in what a route actually costs you. Two providers quoting an identical $0.006 per minute rate on the same destination can produce meaningfully different total bills once billing increments, route quality, and volume terms are factored in — and none of those differences show up if you only compare the headline number.
The comparison problem isn't that providers are hiding anything necessarily — it's that a rate quote is a partial answer by design, optimized to look competitive at a glance, and turning it into a genuinely comparable number takes a few extra steps most buyers skip under time pressure.
This matters more the larger your traffic volume gets. On a handful of test calls, the gap between a properly normalized comparison and a headline-rate comparison is trivial — a few cents either way. At tens of thousands of minutes a month, that same gap compounds into a real budget line, which is exactly why procurement teams evaluating wholesale VoIP at scale build a comparison process instead of eyeballing a rate sheet.
Normalizing Billing Increments Before You Compare Anything
Billing increments determine how a call's duration gets rounded for billing purposes, and this single factor can swing your effective cost more than a fractional difference in the quoted rate.
- 12-second call — billed at 12 seconds under 1/1; also 12 seconds under 6/6, since it's already a multiple of six
- 25-second call — billed at 25 seconds under 1/1; rounded up to 30 seconds under 6/6
- 47-second call — billed at 47 seconds under 1/1; rounded up to 48 seconds under 6/6
A quote at a lower per-minute rate but billed in 6/6 increments can cost more in practice than a slightly higher rate billed 1/1, and the gap widens the more your traffic mix skews toward shorter calls. Before comparing two rates as numbers, convert them to the same billing basis using your own realistic average call duration — not the vendor's example, since a call center's short-call-heavy traffic and an enterprise's long-call-heavy traffic will show a completely different winner between the same two quotes.
A rough way to normalize: take your historical average call duration, round it up under each provider's billing increment, and divide the quoted rate by that rounded duration instead of the raw duration. Run that calculation once per provider on the same reference call length, and the increment stops being an invisible variable — it becomes part of the number you're actually comparing.
Further reading: how to read a wholesale rate deck
Comparing Route Quality Tiers, Not Just the Rate
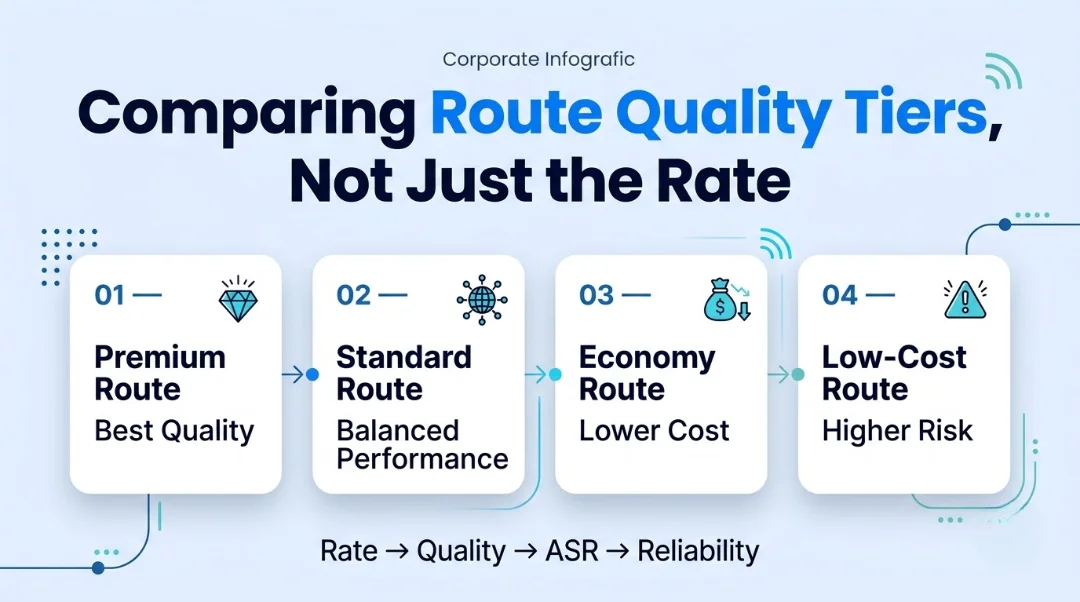
Wholesale providers commonly sell the same destination at multiple price points corresponding to different quality tiers — often labeled something like Premium, Standard, and Economy — and comparing rates across providers without matching tier is comparing different products entirely.
- Premium tier — routed through direct interconnects, typically the highest ASR and cleanest CLI handling, priced accordingly
- Standard tier — a reasonable quality-to-cost balance, often the default tier most buyers land on without specifically requesting otherwise
- Economy or grey-adjacent tier — the cheapest headline rate, often routed through intermediary carriers or less direct paths, with correspondingly lower and less predictable ASR
A Premium-tier quote from one provider against an Economy-tier quote from another will always show the Economy quote as "cheaper" on paper, while producing a worse effective cost once failed and re-attempted calls are factored in. Always confirm which tier a quote represents before comparing it to anything else.
Volume Commitments and the Cost of Missing Them
A discounted rate contingent on a monthly volume commitment isn't really the rate you're being quoted — it's the rate you get only if your actual traffic hits the target, with a separate, higher fallback rate applying to any shortfall or to the whole month depending on how the contract is structured.
When comparing a committed rate against a non-committed one, model your realistic traffic against the commitment threshold honestly, including seasonal dips, rather than assuming your best month is representative. A committed rate that looks better on the quote sheet can end up costing more overall if your actual volume regularly falls short and triggers the fallback rate.
Hidden Surcharges That Change the Real Total
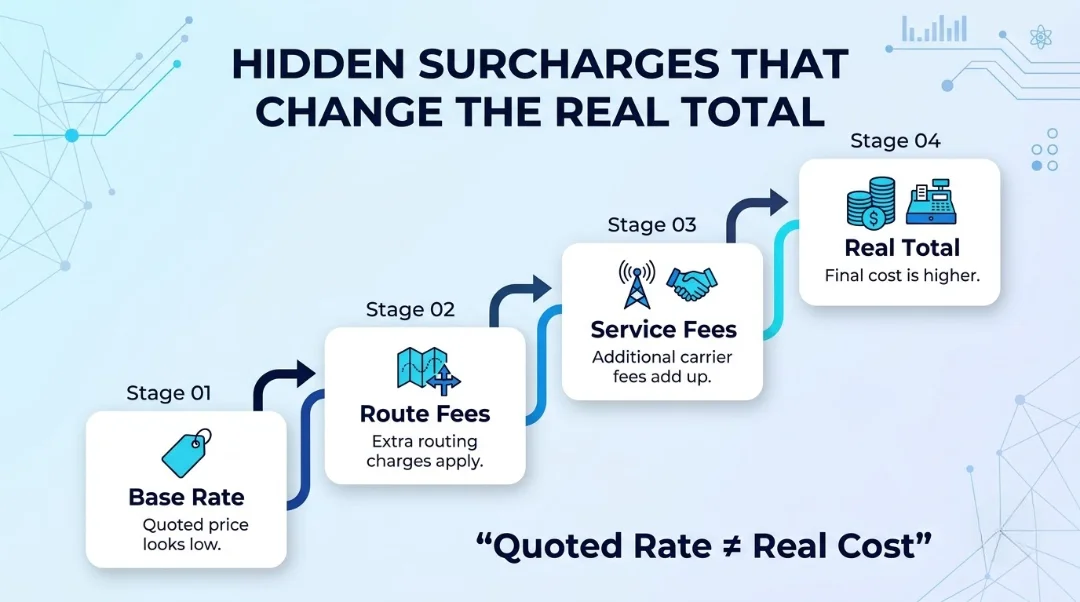
The quoted per-minute rate typically excludes several categories of charges that still land on the invoice, and comparing quotes without accounting for these produces a false sense of which one is actually cheaper.
- Regulatory surcharges — Universal Service Fund contributions, E911 fees, and similar charges commonly add a percentage on top of the quoted rate in US-bound traffic specifically
- Minimum call charges — a per-call minimum billed regardless of actual duration, which disproportionately affects traffic with many short call attempts
- Setup, port, and monthly account fees — one-time or recurring charges unrelated to per-minute usage but real costs nonetheless
- DID and channel fees — recurring charges for number inventory or reserved capacity that don't appear in a per-minute rate comparison at all
Requesting an all-in effective rate — the quoted per-minute price plus every applicable surcharge, modeled against your expected volume — from every provider you're comparing turns four incompatible quote sheets into one apples-to-apples number.
Further reading: FCC: Universal Service Fund
Building a Simple Rate Comparison Worksheet
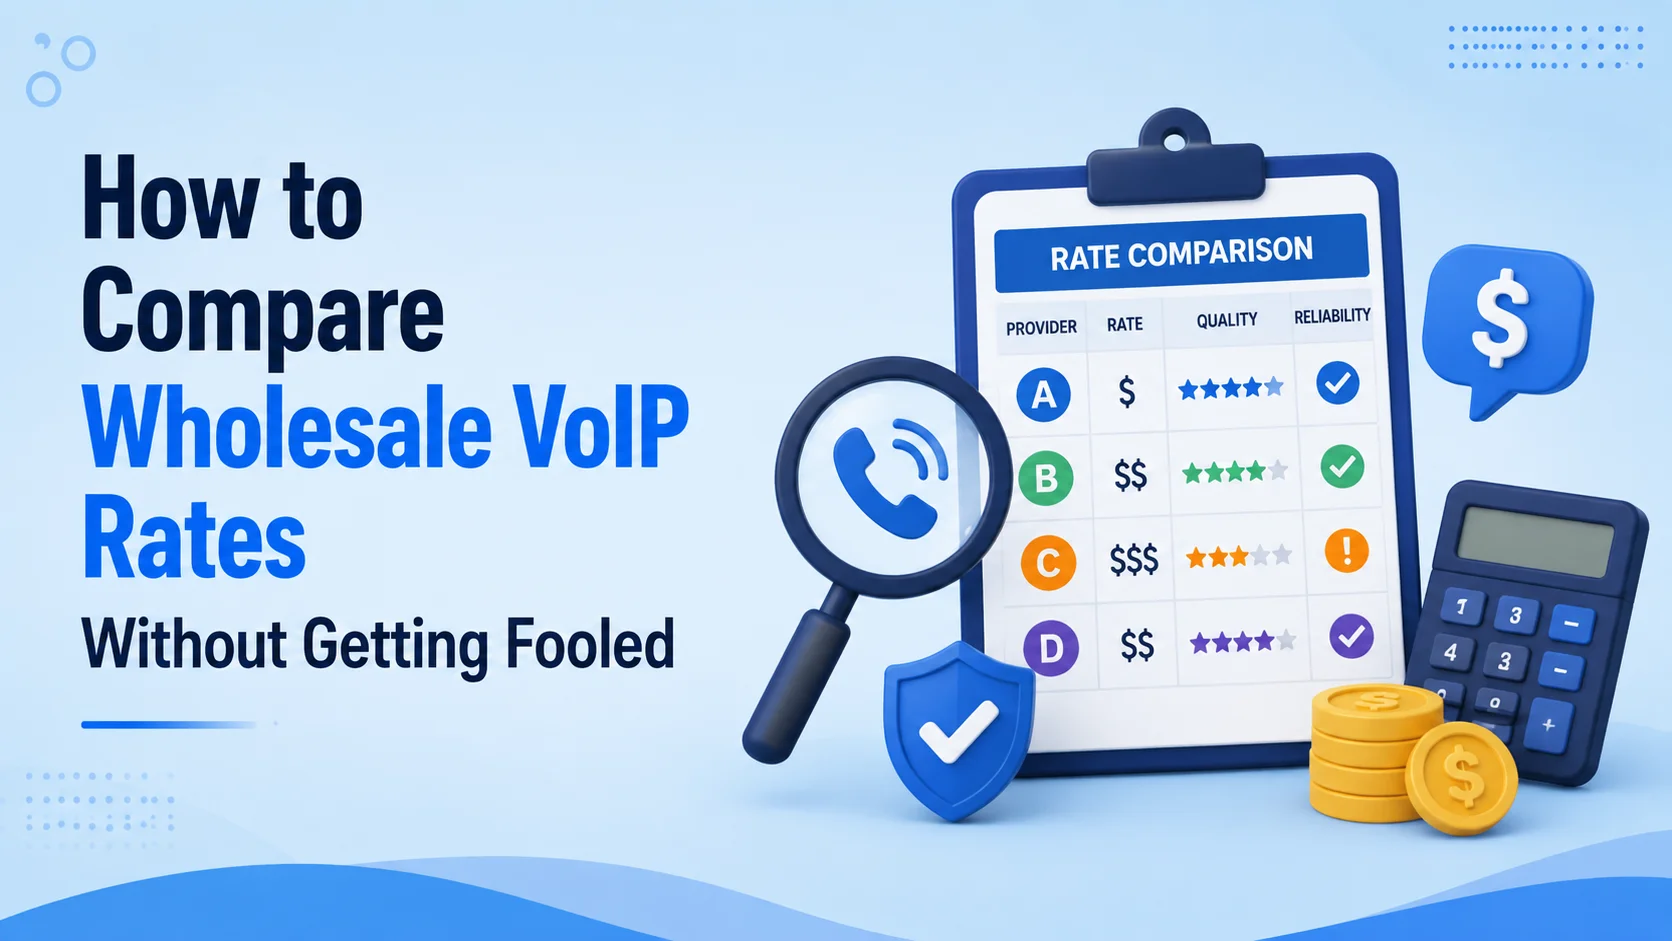
The practical fix for all of the above is a worksheet, not a spreadsheet of headline rates. For each quote, record the quoted rate, the billing increment, the confirmed quality tier, the volume commitment terms and fallback rate, and every surcharge that applies to your traffic profile. Then calculate one number per quote: total expected monthly cost against your actual historical traffic volume and call-duration distribution, not a generic or vendor-supplied example.
This single number — not the headline rate — is what should drive the decision. It's common for the process to reorder rankings entirely: a quote that looked like the obvious winner on rate alone sometimes ends up the most expensive option once increments, tier, commitments, and surcharges are all accounted for against real traffic.
Further reading: wholesale VoIP termination rates explained
A Worked Example: Comparing Three Quotes Side by Side
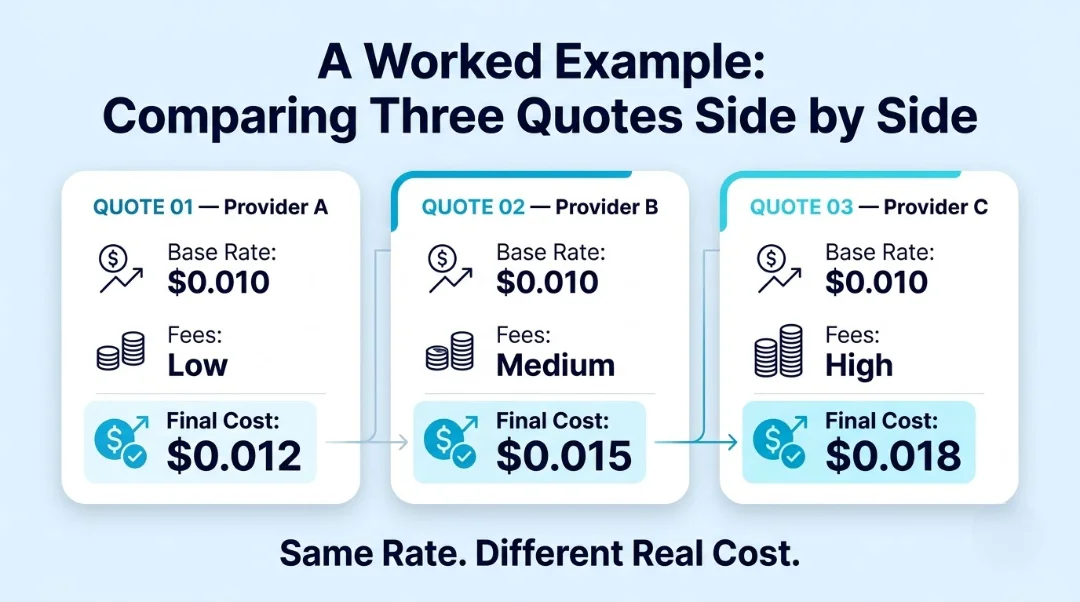
Consider three quotes for the same destination, all pitched as competitive. Provider A quotes $0.007 per minute, 1/1 billing, Standard tier, no volume commitment. Provider B quotes $0.0065 per minute, 6/6 billing, Standard tier, no commitment. Provider C quotes $0.006 per minute, 1/1 billing, Economy tier, with a 500,000-minute monthly commitment and a $0.009 fallback rate.
On headline rate alone, Provider C looks cheapest, followed by B, then A. Run the same three quotes against a business placing mostly short calls — customer support traffic averaging 90 seconds — at 300,000 minutes a month, below Provider C's commitment threshold:
- Provider A — $0.007 per minute on true duration, no rounding penalty, no tier discount to account for; the effective rate stays at $0.007
- Provider B — the 90-second average rounds up under 6/6 billing, adding a small but real premium on top of the quoted $0.0065, narrowing the apparent gap with Provider A significantly
- Provider C — since actual volume falls short of the 500,000-minute commitment, the account bills at the $0.009 fallback rate for the month, making it the most expensive of the three despite having the lowest headline number
The ranking flips entirely once increment, tier, and commitment risk are modeled against this specific business's real traffic — Provider A, the highest headline rate, ends up the most predictable and often the cheapest effective option. A different traffic profile, higher volume and longer average call duration, could just as easily make Provider C the right choice. The point isn't that any one provider type wins by default — it's that the headline number alone can't tell you which one does for your traffic.
Conclusion
The rate on a wholesale VoIP quote sheet is a starting point for a comparison, not the comparison itself. Two identical-looking numbers can produce meaningfully different bills once billing increments, route quality tier, volume commitment terms, and surcharges are factored in against your actual traffic — and skipping that normalization step is how a business ends up choosing the more expensive option while believing they picked the cheaper one.
Build the comparison around one all-in effective rate per quote, modeled against your real traffic, and the headline number stops being the thing that decides anything on its own.